ArcGIS Experience Builder has become the standard way to build modern web GIS applications. However, many implementations still rely on static, pre-configured layers and views.
GIS administrators publish the layers. GIS administrators configure the joins. GIS administrators create the renderers. GIS administrators decide which thematic views users can access.
When operational users want a different visualisation, a different dataset, or a different analytical perspective, the answer is often another hosted feature layer, another hosted view, or another request back to the GIS team.
This creates growing overhead for GIS administrators, including duplicated hosted feature layers, increasing ArcGIS Online storage consumption, rising credit usage, and ongoing maintenance complexity. It also slows down decision-making, as users are dependent on GIS teams to deliver variations.
At the same time, end users increasingly expect to explore data dynamically and answer their own questions without needing a GIS specialist to pre-configure every possible outcome.
What if Experience Builder apps could become more interactive analytical environments instead of static interfaces?
That is the thinking behind two new ArcGIS Experience Builder widgets from Cartinuum:
- Layer Attribute Enrichment
- Layer Style Editor
Together, these widgets allow end users to dynamically enrich layers with external data and instantly experiment with thematic mapping directly inside Experience Builder.
You can skip to the bottom of this article to view a video walk-through of these widgets in action.
What these widgets enable
These widgets introduce a new self-service model for ArcGIS Experience Builder:
- Enable runtime data enrichment without republishing layers
- Reduce duplication of hosted feature layers
- Lower ArcGIS Online storage and credit consumption
- Support dynamic, user-driven thematic mapping
- Empower operational users to explore data independently
Together, these capabilities shift Experience Builder from static applications to interactive analytical environments.
Dynamic runtime data enrichment
The Layer Attribute Enrichment widget allows users to join simple CSV files stored in ArcGIS Online or ArcGIS Enterprise directly to map layers at runtime.
No ETL pipelines. No geoprocessing services. No republishing feature layers. No database joins.
All processing happens client-side in the browser, meaning the source feature service is not modified.
Users can:
- select CSV files stored in their portal,
- define join relationships,
- choose which attributes to include,
- apply filters,
- and generate enriched layers dynamically.
The result is a temporary client-side feature layer that behaves like a standard Experience Builder data source and can be consumed by tables, popups, and other widgets.
This creates powerful self-service GIS workflows while dramatically reducing administrative overhead.
A common ArcGIS Online challenge
A surprisingly common ArcGIS Online pattern is the creation of multiple hosted feature layers containing largely identical geometry. In many organisations, this pattern becomes a primary driver of ArcGIS Online storage growth and ongoing governance complexity.
The only differences are often:
- additional joined attributes,
- filtered records,
- or alternate thematic views.
This increases:
- hosted feature storage,
- ArcGIS Online credit consumption,
- layer sprawl,
- maintenance effort,
- and the risk of stale or inconsistent data.
In many cases, organisations publish entire hosted feature services simply to expose additional spreadsheet-based attributes.
The Layer Attribute Enrichment widget provides an alternative approach.
Instead of permanently publishing enriched datasets, users can dynamically join tabular data to layers when needed.
This is particularly valuable for workflows involving:
- census and demographic datasets,
- climate models and risk scenarios,
- business and economic analysis,
- survey results,
- and rapidly changing operational data.
Because CSV files can be stored directly in your ArcGIS portal, organisations can maintain lightweight, flexible enrichment datasets without needing to continuously publish new hosted feature layers (and without consuming ArcGIS Online credits).
Dynamic thematic mapping without republishing layers
Adding data is only part of the story.
Once users have enriched a layer, they often want to explore the data visually.
Traditionally, this usually requires GIS administrators to create and publish additional thematic layers or configure multiple renderers in advance.
The Layer Style Editor widget changes that model completely.
The widget allows end users to dynamically adjust polygon layer symbology and thematic mapping at runtime directly within ArcGIS Experience Builder.
Users can:
- select attributes,
- switch between thematic mapping methods,
- apply colour ramps,
- classify data,
- and instantly update map rendering.
All renderer changes are client-side and session-based. The source feature service is never modified.
This gives users the freedom to experiment visually without requiring:
- Creator user type,
- layer duplication,
- republishing,
- or GIS administrator involvement.
Supporting exploratory workflows
This becomes especially powerful for analytical workflows where users need to compare different perspectives quickly.
For example:
- climate adaptation teams comparing flood, heat, and bushfire risk layers,
- business analysts reviewing demographic patterns,
- planning teams exploring socioeconomic indicators,
- or operational users testing different visualisation approaches during workshops.
Instead of waiting for predefined thematic maps, users can answer their own questions dynamically.
Experience Builder apps become more interactive analytical environments rather than static reporting tools.
Walk-through: Dynamic enrichment and styling
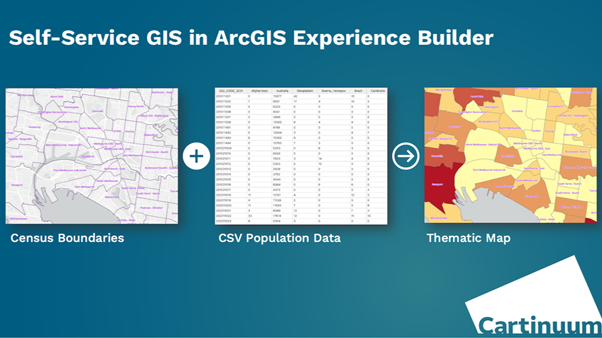
To demonstrate these widgets, we built a simple Experience Builder application using SA2 statistical boundaries for Melbourne, Australia.
Initially, the layer contains only two attributes:
- SA2 code
- SA2 name
We then dynamically enrich the layer using census data stored in CSV files hosted in ArcGIS Portal.
Step 1 — Start with a lightweight boundary layer

Map showing SA2 statistical areas in Melbourne, Australia
The starting layer is intentionally minimal. No demographic attributes are published with the feature layer.
This keeps the source layer lightweight and reduces unnecessary hosted data storage.
Step 2 — Enrich the layer using CSV data

Layer Attribute Enrichment Widget in ArcGIS Experience Builder
Using the Layer Attribute Enrichment widget, users can:
- select a CSV file,
- define join keys,
- choose which attributes to include,
- and optionally apply filters.
The enrichment process runs entirely in the browser.
Step 3 — Review enriched attributes

Viewing the Enriched Population Characteristics in a Pop-Up
Once enrichment is complete, the generated client-side layer contains the additional census attributes and behaves like a normal Experience Builder layer.
Users can immediately interact with the enriched data through popups, tables, and other widgets.
Step 4 — Apply dynamic thematic mapping

Using the Layer Styling Widget to Create a Thematic Map
Next, the Layer Style Editor widget is used to configure symbology dynamically.
Users can select different attributes and mapping methods including:
- unique values,
- graduated colours,
- and classifications.
Step 5 — Explore different analytical views

Thematic Map showing Population Density of 0-4 Year Olds
Users can instantly experiment with different visualisations without creating new hosted layers or requiring GIS administrator intervention.
This dramatically improves exploratory workflows and stakeholder engagement.
Together, runtime enrichment and dynamic styling allow users to move seamlessly from data integration to visual analysis within a single Experience Builder session.
Flexible governance for GIS teams
While these widgets empower end users, GIS administrators still retain control over how much flexibility is exposed.
For example, authors can choose whether users:
- can create their own enrichment definitions,
- use only predefined configurations,
- apply filters,
- or freely experiment with available datasets.
This allows organisations to balance governance with self-service capability.
Managed Experience Builder for ArcGIS
Cartinuum’s Managed Experience Builder for ArcGIS provides a managed environment for building and running Experience Builder applications with custom widgets, without requiring organisations to maintain their own developer infrastructure. This makes advanced Experience Builder capabilities far more accessible while reducing operational overhead.
Traditionally, using custom widgets often meant:
- installing Experience Builder Developer Edition,
- managing Node.js environments,
- handling upgrades,
- and maintaining local development workflows.
Managed Experience Builder for ArcGIS from Cartinuum simplifies this process.
It provides a managed environment for building and running ArcGIS Experience Builder applications with custom widgets, without requiring organisations to maintain their own developer infrastructure.
This makes advanced custom Experience Builder capabilities far more accessible to ArcGIS Online users.
Moving beyond static GIS applications
ArcGIS Experience Builder applications do not need to be static interfaces built entirely around predefined workflows.
With runtime enrichment and dynamic styling, ArcGIS Experience Builder apps can become interactive analytical environments that adapt to the questions users are trying to answer.
For GIS teams, this means:
- reduced administrative overhead,
- fewer duplicated hosted layers,
- lower ArcGIS Online storage consumption,
- and more empowered end users.
For operational users, it means greater freedom to explore data, test ideas, and create meaningful visualisations without waiting for new layers or map updates.
See it in action
Watch the full demo walkthrough video to see the workflow in action, including:
- runtime CSV enrichment,
- dynamic thematic mapping,
- and self-service analytical workflows inside ArcGIS Experience Builder.
You can also explore live previews of both widgets.
Frequently Asked Questions
Can you join CSV data in ArcGIS Experience Builder?
Yes. The Layer Attribute Enrichment widget allows users to join CSV data stored in ArcGIS Online or ArcGIS Enterprise to layers at runtime without republishing.
Does runtime enrichment consume ArcGIS Online credits?
Because enrichment is performed client-side, it avoids the need to publish additional hosted feature layers, reducing storage-related credit consumption.
Can users change symbology in ArcGIS Experience Builder without editing layers?
Yes. The Layer Style Editor widget enables users to dynamically adjust thematic mapping at runtime without modifying the source feature service.
How does this reduce hosted feature layer duplication?
Instead of creating multiple layers for different joins or styles, users can generate variations dynamically within a single application session.

/Email%20Module%20Assets/linkedin.png)
